CORP: A Multi-modal Dataset for Intelligent Campus Roadside Perception Tasks
About this work
To propel advancements in roadside perception technology, numerous roadside datasets have been created with a primary focus on high-density traffic flows along urban arterial roads, intersections, and highways. However, within residential areas such as university campuses and public parks, we found the environment faced in roadside perception tasks exhibits significantly different aspects:
- (1) Compared with the dominant flow of motorized vehicles in urban traffic, a higher density of active pedestrians and cyclists appears in campus scenarios.
- (2) Unlike the linearly structured urban arterial roads, residential campuses present distinct physical layouts characterized by tightly packed buildings, lush vegetative areas, narrower paths with frequent corners, and vehicle-restricted zones that complicate navigation.
- (3) The lack of traffic ordinances and control systems introduces considerable intricacies into the analysis of trajectories and behavioral patterns of road user.
The aforementioned observations suggest a new research frontier wherein residential areas resembling university campuses offer unique research opportunities and practical deployment contexts, thereby expanding the horizons of roadside perception technology development beyond conventional urban street environments. Inspired by this insight, we have innovatively developed the CORP (Campus-Oriented Roadside Perception) dataset, which constitutes the pioneering large-scale, multi-modal dataset tailored explicitly for roadside perception in campuses and extensive public domains.
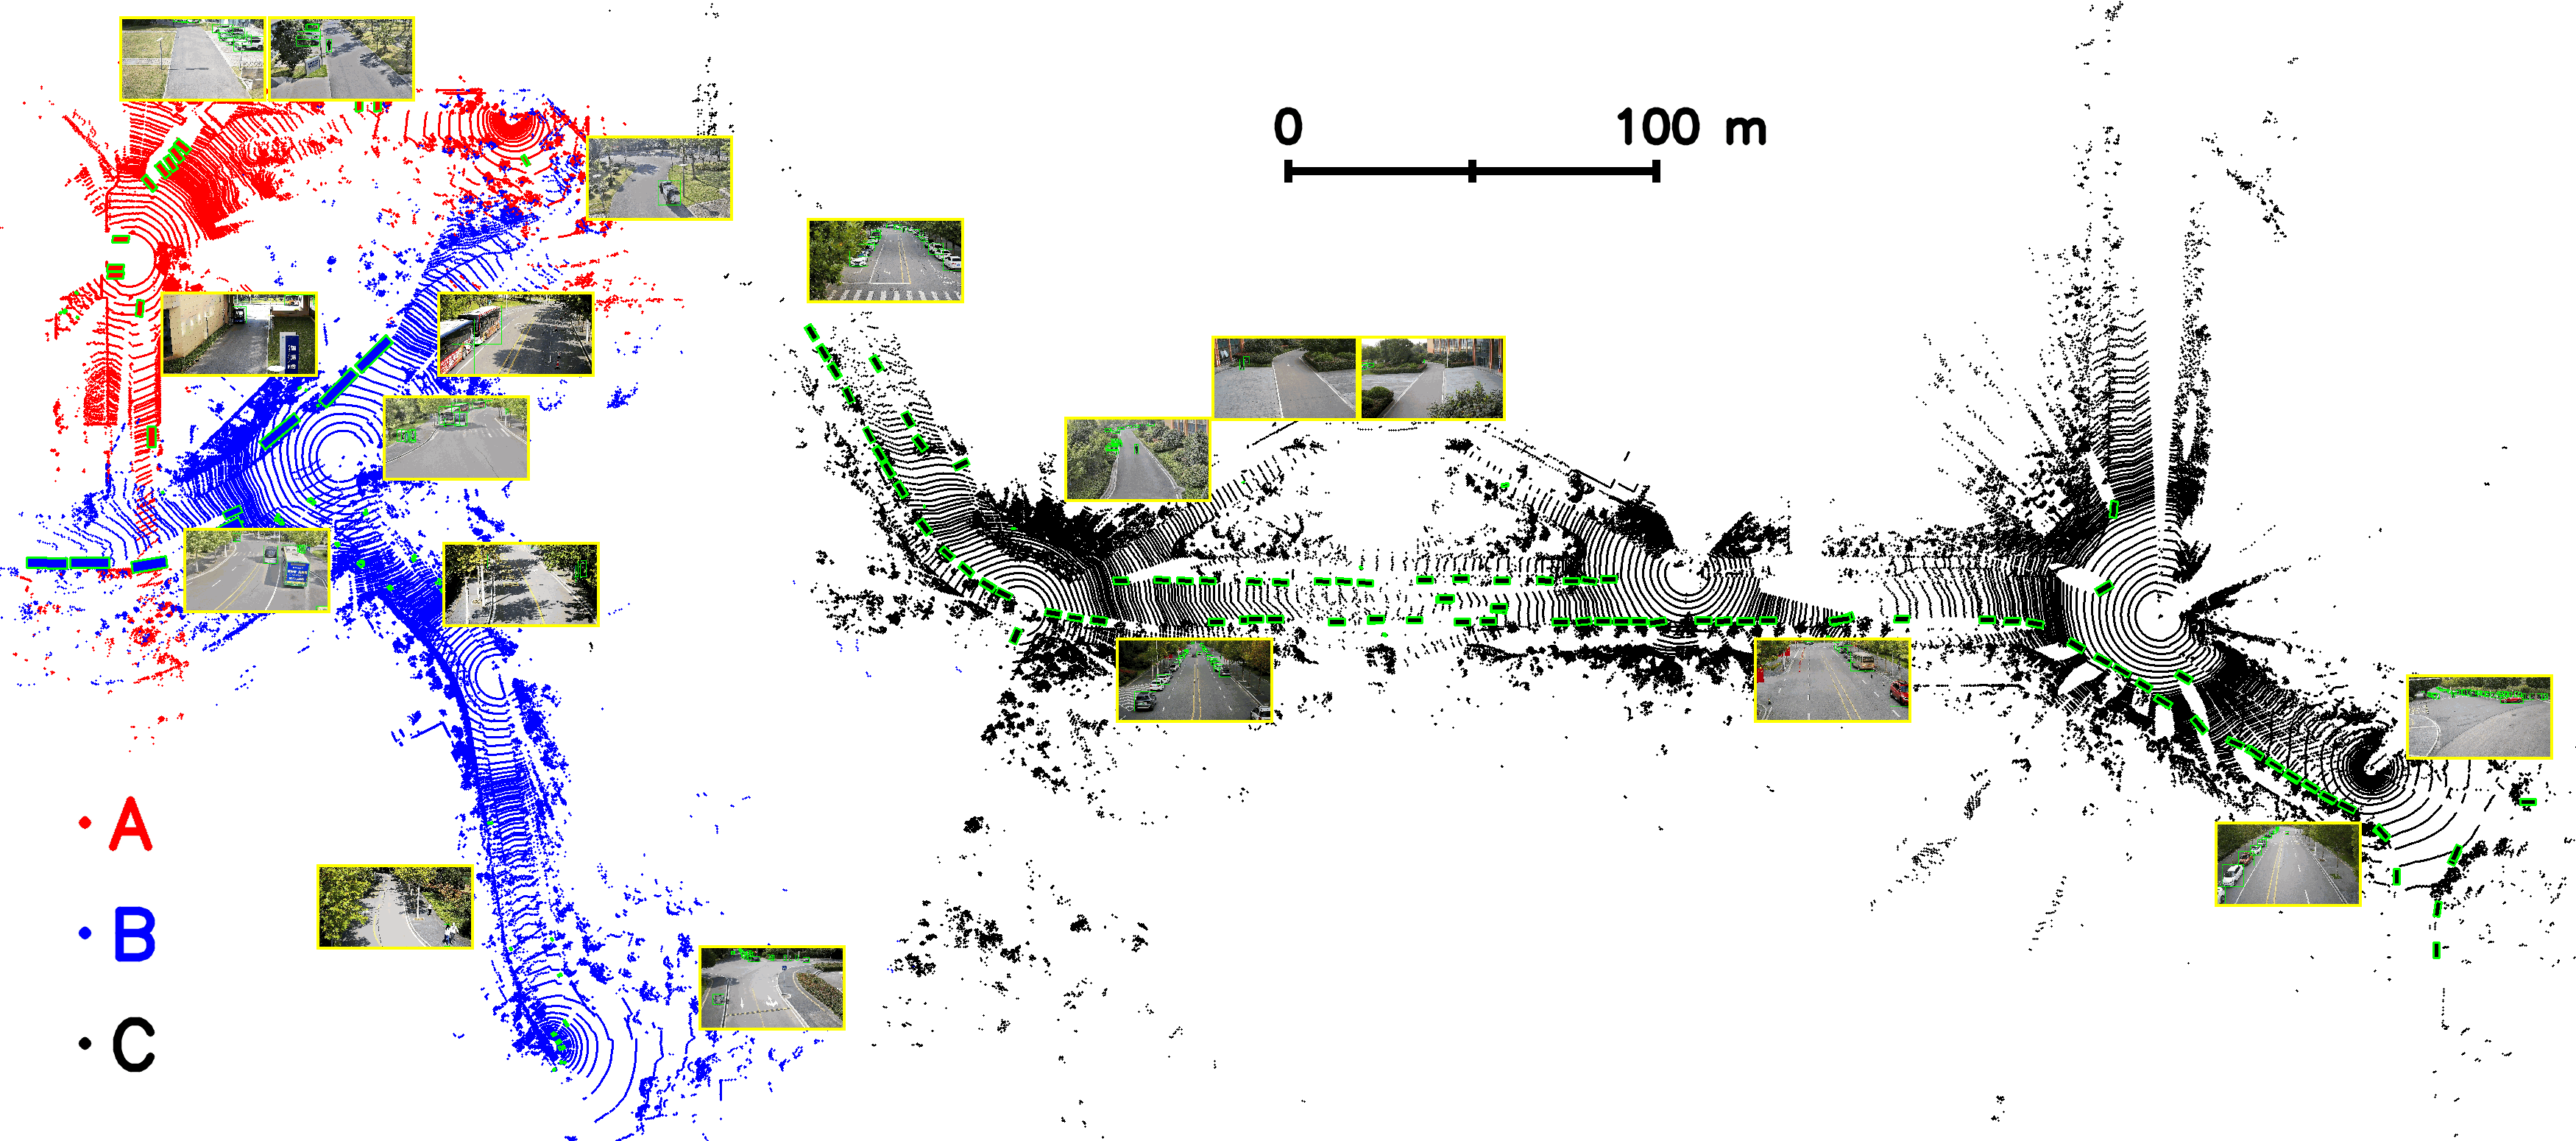
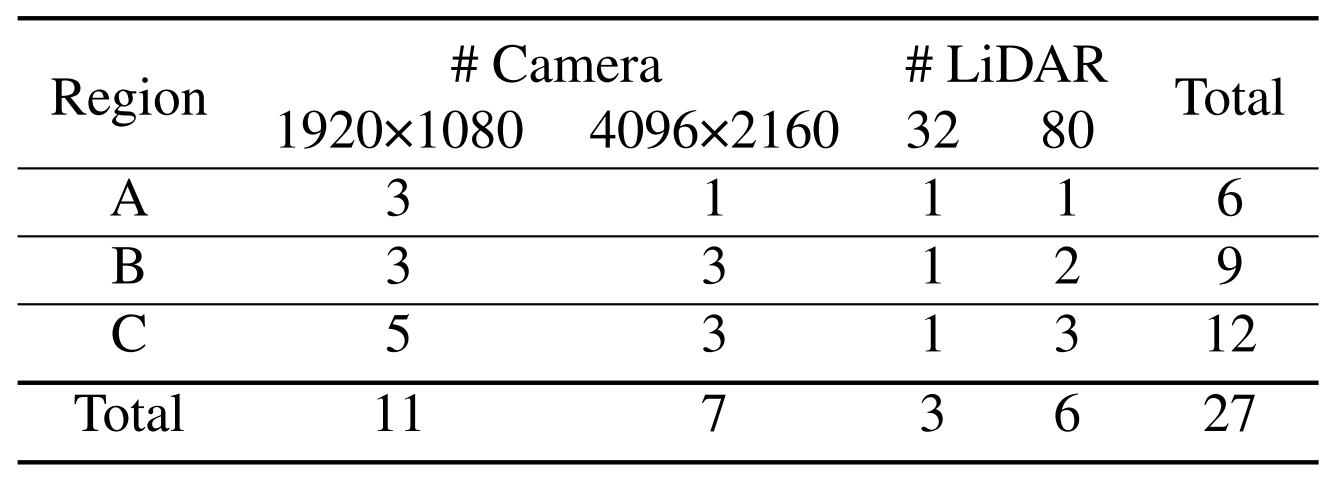
In CORP, a total number of 18 cameras and 9 LiDARs with diverse specifications have been employed and installed at varying locations on roadside poles across a university campus, capturing rich scene information from various perspectives. According to the number of sensors and the complexity of scenes, we have partitioned the CORP dataset into three regions, denoted as A, B, and C. An example data episode in CORP is visualized under BEV in Fig. 1, where point clouds from the 3 regions are colored in red(A), blue(B) and black(C), respectively, with the sensor configurations specified in Fig. 2.
Contributors
Beibei Wang, Lu Zhang, Yao Li, Haojie Ren, Yuxuan Xiao, Yuru Peng, Jianmin Ji, Yu Zhang, Yanyong Zhang*
If you have any questions about CORP, please contact corp_ustc@163.com.